MSSQLWIKI

Karthick P.K on SQL Server

Archive for October, 2012

SQL Server 2012 Memory

Posted by Karthick P.K on October 21, 2012

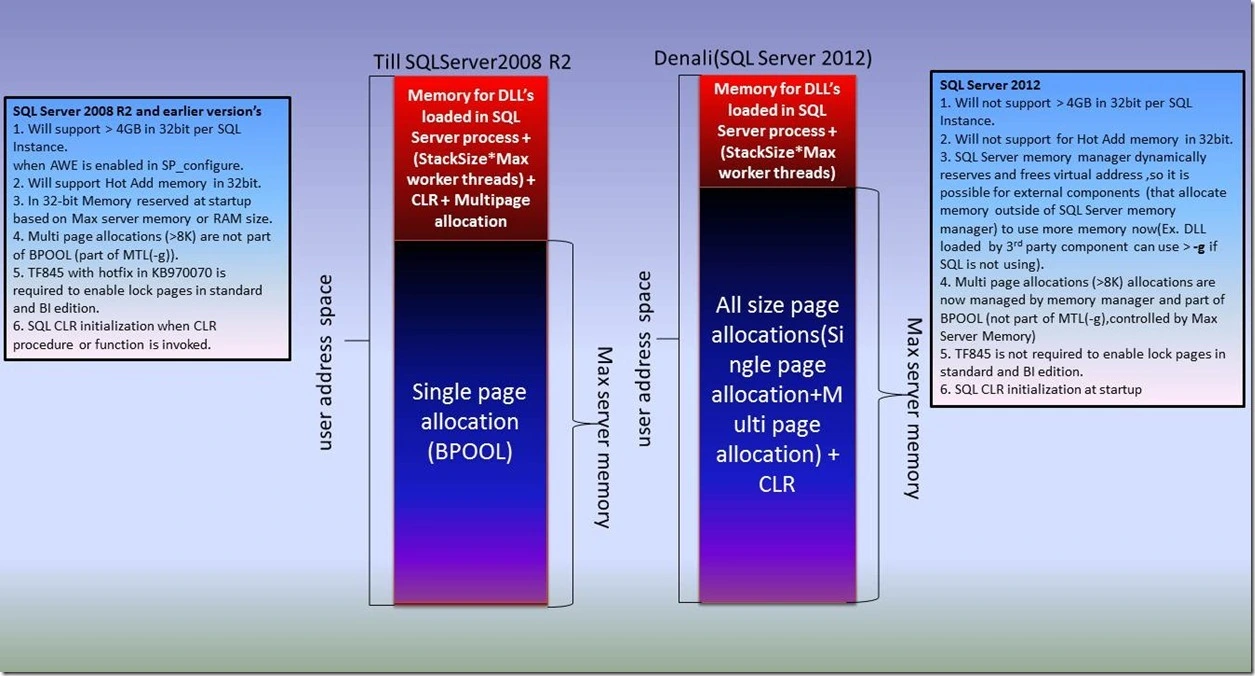
SQL Server 2012 has made many changes to the memory manager to govern the SQL Server memory consumption in efficient way compared with earlier versions. Important changes to SQL Server 2012 memory which every DBA should be aware of is documented in this blog. If you are not familiar with the SQL Server memory architecture of earlier versions I would recommend reading THIS ARTICLE  before you continue with changes in Denali memory manager.

clip_image001
Max Server Memory

In previous versions of SQL Server “Max Server Memory” controlled the Maximum physical memory Single page allocator (BPOOL)  can consume in SQL Server user address space.

Only the single page allocator was part of BPOOL and Max server memory controlled only BPOOL, so the following allocations came outside BPOOL (Max server memory)

1.Multi-Page allocations from SQL Server [These are allocations which request more > 8 KB and required contiguous memory]

2.CLR allocations [These include the SQL CLR heaps and its global allocations created during startup]

3.Memory used for thread stacks within SQL Server process (Max worker threads * thread stack size). Thread stack size is 512K in 32 bit SQL Server, 904 K in WOW mode and 2 MB in 64-Bit 

4.Direct windows allocations made by Non-SQL Server dll’s ([These include windows heap usage and direct virtual allocations made by modules loaded into SQL Server process. Examples: allocations from extended stored procedure dll’s, objects created using OLE Automation procedures (sp_OA calls), allocations from linked server providers loaded in sqlserver process)


SQL Server 2012 memory manager has now clubbed single page allocator and multipage allocator together  as any-size page allocator . As a result, the any-size page allocator now manages allocations categorized in the past as single page and Multi-Page allocations.

1. "max server memory" now controls and includes “Multi pages allocations”.

2. In earlier versions of SQL Server CLR allocated memory was outside BPOOL (Max server memory)   . SQL Server 2012 includes SQL CLR allocated memory in "max server memory".

SQL Server 2012 "max server memory" configuration does not include only the following allocations:

1. Memory allocations for thread stacks within SQL Server process

2. Memory allocation requests made directly to Windows [Ex: Allocations (Heap,Virtualalloc calls ) from 3rd party Dll’s loaded in SQL Server process , objects created using OLE Automation procedures (sp_oa) etc]

These changes allow DBA’s to configure and control SQL Server more accurately in accordance with the memory requirements and using resource governor.

-g startup parameter

We used the -g startup option to change the default value of a region in SQL Server user address space known as "Memory-To-Reserve". This region was also known as "memory-to-leave or MTL.  The "Memory-To-Reserve" (or) -g configuration option are relevant only for a 32-bit instance of SQL Server.

Multi pages allocation and CLR was part of Mem-to-reserve (-g)  in In previous SQL Server versions until SQL Server 2008 R2 , From Denali they are part of BPOOL (Controlled by Max server memory)  So you may have to remove –g if you have set it to give space for multipage allocator or CLR in earlier versions and migrating to Denali now.


AWE feature removed from SQL Server 2012

AWE feature was used in earlier versions of 32-Bit SQL Server to address more than 4GB of memory . This feature is now removed in Denali  refer:"AWE deprecation".  So if you need more memory then you may need to migrate to 64-Bit SQL server.


Locked pages in memory

Trace flag 845 is no more required to Lock Pages in memory. As long as the startup account of SQL Server has “Lock pages in memory” privilege Datacenter, Enterprise, standard and Business intelligence edition will use AWE allocator Api’s for memory allocations in BPOOL and this allocations will be locked.

 
Dynamic virtual address space management

In earlier versions of SQL Server 32-Bit we reserved Bpool at the startup and remaining addresses are left for MTL (Memory to reserve or Memory to leave) . In Denali virtual address space management is dynamic (we  don’t reserve at startup) , So it is possible for 3rd part components to use more memory than what is  configured in –g parameter.

 
SQLCLR loaded at startup

In earlier SQL Server versions, Common language runtime (CLR) functionality is initialized inside SQL Server process when the first SQL CLR procedure or function is invoked. SQL Server 2012 performs SQL CLR initialization at startup. The initialization is independent of the ‘clr enabled’ configuration option.

You will notice the following messages in the SQL Server error log during server startup:

2012-10-18 15:23:13.250 spid8s       Starting up database ‘master’.

2012-10-18 15:23:13.930 Server       CLR version v4.0.30319 loaded.

Total Physical memory and memory model used

Total physical memory available on the server and the memory model  used is logged in SQL Server error log

2012-10-18 15:23:06.690 Server       Detected 131067 MB of RAM. This is an informational message; no user action is required.

2012-10-18 15:23:06.700 Server       Using locked pages in the memory manager

2012-10-22 15:32:20.450 Server       Detected 131067 MB of RAM. This is an informational message; no user action is required.
2012-10-22 15:32:20.450 Server       Using conventional memory in the memory manager.


DMV and Performance counter changes

In earlier version of SQL Server most of the DMV’s used single_pages_kb and  multi_pages_kb to refer allocations by SQL Server with in BPOOL and outside BPOOL. Now they are represented together as  pages_kb. More details in THIS link


If you liked this post, do like us on Facebook at https://www.facebook.com/mssqlwiki and join our Facebook group


Thank you,

Karthick P.K |My Facebook Page |My Site| Blog space| Twitter

Disclaimer:

The views expressed on this website/blog are mine alone and do not reflect the views of my company. All postings on this blog are provided “AS IS” with no warranties, and confers no rights.


Posted in Memory, SQL General, SQL Server Engine, SQL Server memory | Tagged: , , , , , , , , , | 19 Comments »

SQL Server Exception , EXCEPTION_ACCESS_VIOLATION and SQL Server Assertion

Posted by Karthick P.K on October 16, 2012


I have got few request’s from  SQL Server DBA’s in past to blog about analyzing SQL Server exceptions and assertions . After seeing lot of DBA’s getting stuck when they get EXCEPTION_ACCESS_VIOLATION (or) Assertion in SQL ServersI decided to write this blog.

This blog is published with intention to make DBA’s analyze and resolve EXCEPTION_ACCESS_VIOLATION and SQL Server Assertion before contacting Microsoft support.  Exception and assertion are two different things. SQL handles both assertions and exceptions by writing the current thread’s stack to the Error log and generating a dump.  In simple An exception is an event that occurs during the execution of a program, and requires the execution of code outside the normal flow of control and assertion is the check that the programmer inserted into the code to make sure that some condition is true, If it returns false an assert is raised. SQL handles both assertions and exceptions by writing the current thread’s stack to the Error log and generating a dump, so trouble shooting steps are similar. 


You will find messages similar to one below in SQL Serve error logs when you get Exception or EXCEPTION_ACCESS_VIOLATION .

{

Error

External dump process returned no errors.
Using ‘dbghelp.dll’ version ’4.0.5′
SqlDumpExceptionHandler: Process 510 generated fatal exception c0000005 EXCEPTION_ACCESS_VIOLATION. SQL Server is terminating this process.
* *******************************************************************************
* BEGIN STACK DUMP:
*  Exception Address = 000000007752485C Module(ntdll+000000000002285C)

*   Exception Code    = c0000005 EXCEPTION_ACCESS_VIOLATION

*   Access Violation occurred reading address 0000041EA9AE2EF0

* Input Buffer 510 bytes –

ex_terminator – Last chance exception handling

}

You will find messages similar to one below in SQL Server error logs when you get an Assertion.

{

Error

spid323     Error: 17065, Severity: 16, State: 1.

spid323     SQL Server Assertion: File: < .cpp>, line = 2576 Failed Assertion = ‘fFalse’  This error may be timing-related. If the error persists after rerunning the statement, use DBCC CHECKDB to check the database for structural integrity, or restart the server to ensure in-memory data structures are not corrupted

SQL Server Assertion: File: <   .cpp>, line=2040 Failed Assertion =

}

To analyze the dump download and Install Windows Debugger from This Link 


Step 1 (Load the memory dump file to debugger):

Open Windbg .  Choose File menu –> select Open crash dump –>Select the Dump file (SQLDump000#.mdmp)

Note : You will find SQLDump000#.mdmp in your SQL Server error log when you get the Exception or assertion.

Step 2 (Set the symbol path to Microsoft symbols server):

on command window type

.sympath srv*c:\Websymbols*http://msdl.microsoft.com/download/symbols;

Step 3 (Load the symbols from Microsoft symbols server):

Type .reload /f and hit enter. This will force debugger to immediately load all the symbols.


Step 4 (check if symbols are loaded):

Verify if symbols are loaded for  SQL Server by using the debugger command lmvm

0:002> lmvm sqlservr

start             end                 module name

00000000`01000000 00000000`03679000   sqlservr T (pdb symbols)          c:\websymbols\sqlservr.pdb\21E4AC6E96294A529C9D99826B5A7C032\sqlservr.pdb

    Loaded symbol image file: sqlservr.exe

    Image path: C:\Program Files\Microsoft SQL Server\MSSQL.1\MSSQL\Binn\sqlservr.exe

    Image name: sqlservr.exe

    Timestamp:        Wed Oct 07 21:15:52 2009 (4ACD6778)

    CheckSum:         025FEB5E

    ImageSize:        02679000

    File version:     2005.90.4266.0

    Product version:  9.0.4266.0

    File flags:       0 (Mask 3F)

    File OS:          40000 NT Base

    File type:        1.0 App

    File date:        00000000.00000000

    Translations:     0000.04b0 0000.04e4 0409.04b0 0409.04e4


Step 5 (Switch to exception context):

Type .ecxr

Step 6(Get the stack of thread which caused exception or assertion):

Type  kC  1000    //You will get the stack of thread which raised exception or assertion .

I have pasted one of the sample stack below, from the exception dump which I worked recently.  First thing to identify from stack is who is raising the exception. In the below stack look at the portion which is highlighted in red (In each frame before the ! symbol), that is the module which raised the exception (Exe or DLL name ).

If Exe/DLL name is Non Microsoft  module (Exe or DLL name ) then the exception is being caused by a third party component, you will need to work with the company that provided that component to get a solution. lmvm Exe/DLL name will give you the company name. For example: lmvm wininet

If Exe/DLL name is  SQLServr  (or) any other SQL Server modules then the exception is raised by SQL Server, In that case type kC 1000 and paste the stack in comments session of this blog (or) When you start thread in MSDN forums (or) In This face book group. If you don’t get any prompt reply from the community, you may need to open a support ticket with Microsoft.

Note: When you get Assertion make sure you post message line which contains   SQL Server Assertion: File: <Filename.cpp>, line = 2576 Failed Assertion =  ”  


0:000> kC 1000

Call Site

wininet!InternetFreeThreadInfo+0x26

wininet!InternetDestroyThreadInfo+0x40

wininet!DllMain_wininet+0xb5

wininet!__DllMainCRTStartup+0xdb

ntdll!LdrShutdownThread+0x155

ntdll!RtlExitUserThread+0x38

msvcr80!_endthreadex+0x27

msvcr80!_callthreadstartex+0x1e

msvcr80!_threadstartex+0x84

kernel32!BaseThreadInitThunk+0xd

ntdll!RtlUserThreadStart+0x1d

If you liked this post, do like us on Facebook at https://www.facebook.com/mssqlwiki and join our Facebook group https://www.facebook.com/mssqlwiki#!/groups/454762937884205/

Related posts:

Thank you,

Karthick P.K |My Facebook Page |My Site| Blog space| Twitter

Disclaimer

The views expressed on this website/blog are mine alone and do not reflect the views of my company. All postings on this blog are provided “AS IS” with no warranties, and confers no rights.

Posted in Debugging, SQL General, SQL Server Engine, Startup failures | Tagged: , , , , , , , , , , , , , , , | 254 Comments »

What is RESOURCE_SEMAPHORE_QUERY_COMPILE?

Posted by Karthick P.K on October 12, 2012

What is RESOURCE_SEMAPHORE_QUERY_COMPILE?

Before we understand the RESOURCE_SEMAPHORE_QUERY_COMPILE let us see what is compile memory.

Compile memory:  When a query is compiled in SQL Server, the compilation process needs memory (for parsing, algeberaization and optimization) called compile memory. This memory doesn’t include the memory required to execute the query.

Challenges with Compile memory:  This memory used for Query compilations are usually expected to fit into SQL Server main-memory and to be relatively short-lived.  Like any other consumers of Bpool,  this is implemented by “stealing” pages from the Buffer Pool and hence it blocks other memory consumers from using that memory until a query compilation completes.

Even if the SQL Server has enough memory to service multiple simultaneous query compilation, allowing all of them to occur at the same time might lead to stealing a significant number of pages from the buffer pool, with consequent increased physical IO , poor performance of query execution and causing memory pressure within SQL Server. However on the other side, a throttling mechanism that is too restrictive could lead to a non-optimal usage of the system resources and decreased throughput for compile intensive workloads, So SQL Server came with more dynamic approach to solve the problem  which  is to better manage system resources, memory in particular. Such management should hence be based on and driven by the amount of memory used.

Let us see it with example:

Assume SQL  Server Max server memory is set to 1000MB and Currently data /index pages is consuming 800MB with in Max server memory (bpool) and 3 queries are reaching SQL Server for compilation, each of them requiring 300 MB for compilation.

If all three queries are compiled simultaneously  total compilation might take 900MB of memory causing all the data and index pages to be dropped from BPOOL causing  consequent increased physical IO and poor performance of query during execution(to bring data pages back to memory). On the other hand let us assume each of this 3 queries need only 2 MB of compilation memory, There is no reason for SQL Server to throttle the number of compilation.

To overcome above challenges SQL 2005+ throttles the number of concurrent compiles that can happen at  any time based on memory usage during the compile. SQL Server memory grant is controlled by a object called “Resource Semaphore” and has internal mechanism to detect how much memory has been used by each compile. There are three gateways (semaphores) called the small, medium, and big gateway. When a request is received for compilation SQL Server will start compilation. There is no limit on how many queries can be compiled simultaneously, but when memory usage for a query reaches the threshold for a given gateway it will then acquire that semaphore of next gateway before continuing. The semaphores (Queries which can be compiled concurrently) are set up to allow 4*schedulers count for the small gateway, 1*schedulers count for the medium gateway and 1 (per SQL instance) for the big gateway.

The small gateway has a fixed threshold for how much memory must be consumed before you enter it.  The medium and big gateways have dynamic thresholds that vary depending on how much memory is available, how much is stolen, etc.

If the semaphore can’t be acquired then you see this wait type (Query is waiting for memory grant to compile a query =  RESOURCE_SEMAPHORE_QUERY_COMPILE wait). This behavior lets SQL Server to allow only a few memory-intensive compilations occur at the same time. Additionally, this behavior maximizes throughput for smaller queries.

clip_image001[4]

How to identify RESOURCE_SEMAPHORE_QUERY_COMPILE waits?


To get an idea look at the sys.sysprocesses  table for sessions waiting on  RESOURCE_SEMAPHORE_QUERY_COMPILE

select sp.*, st.text from sys.sysprocesses sp CROSS APPLY sys.dm_exec_sql_text(sp.sql_handle) AS st

WHERE sp.lastwaittype LIKE ‘RESOURCE_SEMAPHORE_QUERY_COMPILE%’ ORDER BY sp.waittime DESC;


clip_image002[4]


There could be two possible reasons for RESOURCE_SEMAPHORE_QUERY_COMPILE waits

1.       Memory pressure within SQL Server caused by others using  lot of stolen memory or OS memory pressure

In this case you will see thresholds for medium and big gateways very low. In this situation you have to identify who is consuming most of stolen memory and  tune them to increase the available memory or add additional memory that can used by SQL server. When the available memory decrease, threshold for medium and big gateways would decrease significantly and increase the number of queries which have to enter medium /big gateways, So the number of parallel compiles will decrease increasing the overall wait time.


This DBCC memory status output is from system which has 48 processor and has excessive RESOURCE_SEMAPHORE_QUERY_COMPILE waits because of memory pressure.

Small Gateway (default)                  Value

—————————————- ———–

Configured Units                         192        // 190 number of units .  48  CPU’s * 4=192

Available Units                            109

Acquires                                         83

Waiters                                            0

Threshold Factor                         380000

Threshold                                       380000

(6 row(s) affected)

Medium Gateway (default)                 Value

—————————————- ———–

Configured Units                         48              //48 number of units. SO 48 CPU’s *1=48

Available Units                               0             //There is no available slots. All slots are busy.

Acquires                                           48

Waiters                                             34           //34 Queries are waiting

Threshold Factor                         12

Threshold                                    2204603    //Threshold is very low 2 MB (This value is in bytes)

(6 row(s) affected)

Big Gateway (default)                    Value

—————————————- ———–

Configured Units                         1            //1 per instance

Available Units                             0            //There is no available slots. All slots are busy.

Acquires                                          1

Waiters                                          47            // 47 Queries are waiting

Threshold Factor                         8

Threshold                                3306905     //Threshold is very low 3 MB (This value is in bytes)


2.       There is huge amount of available memory but the available units in gateway is exhausted. This situation normally occurs when we have many queries that have high compile time and use lot of memory for compilation.

Compile time and Compile memory can be captures using the show plan XML for query compile event in profiler.

Below is extract from show plan XML for query compile event in profiler. This query has used approximately 150 MB of compile memory and the threshold for Big gateway is around 143 MB . So only one query which needs more than 143 MB can compile at a time , This can cause contention when there are multiple queries waiting for compile/recompile. Also an important factor to notice in this XML plan is compile time is ~139 times the CPU. So likely this query waited for most of the time for resource semaphore.

Big Gateway (default)                    Value

—————————————- ———–

Configured Units                         1

Available Units                             0

Acquires                                         1

Waiters                                          47

Threshold Factor                         8

Threshold                                149640500


         <QueryPlan CachedPlanSize="312" CompileTime="139847" CompileCPU="1002" CompileMemory="152320">


How to fix RESOURCE_SEMAPHORE_QUERY_COMPILE waits?

1.       Add additional memory to SQL Server.

2.       Reduce the number of compile and recompiles happening in SQL Server.

3.       Threshold for the gateways are dynamic (except for small gateway) and therefore memory pressure occurs from other sources (Internal to SQL Server or system wide) reduces the  amount of memory available for compiles and Queries are throttled to    higher gateways sooner. Make sure SQL Server is not starving for memory.

4.       Identify the queries which are consuming large compile memory and tune them (CompileMemory  in show plan XML query compile can be used).

5.       RESOURCE_SEMAPHORE_QUERY_COMPILE waits are very common in 32-bit SQL Server because of virtual address space limitation, so migrate to 64-Bit SQL Server.


If you liked this post, do like us on Facebook at https://www.facebook.com/mssqlwiki and join our Facebook group https://www.facebook.com/mssqlwiki#!/groups/454762937884205/

Thank you,

Karthick P.K |My Facebook Page |My Site| Blog space| Twitter

Posted in Memory, Performance, SQL Query, SQL Server Engine | Tagged: , , , , , | 14 Comments »

SQL Server Parameter sniffing

Posted by Karthick P.K on October 8, 2012

When a stored procedure, prepared queries and queries submitted via sp_executesql  is compiled for the first time, the values of the parameters supplied with the execution call are used for cardinality estimation, to optimize the statements within that stored procedure and create the query plan. This is known as parameter sniffing because the optimizer sniffs the current parameter value during compilation.

If these values are typical and the data distribution is even in the underlying tables, all the calls to the stored procedure will benefit from this query plan since the plan is reused. However, parameter sniffing can cause problems if the "sniffed" parameter value is not typical of the values which are actually used during a typical execution or the data in underlying tables are very skewed, because plan generated for “sniffed” parameter value may not be optimal for current parameter passed and since the plan is reused there can be performance degradation.

Consider the following scenario we have a table with two columns (country and some column ). This table has 10001 rows.  10000 rows has USA in country column and 1 row has brazil in country column.


This table has NONCLUSTERED INDEX called NC on country column.


create table data(country char(10),somecolumn char(10))

go

insert into data values (‘BRAZIL’,‘somedata’)

go

insert into data values (‘USA’,‘somedata’)

go 10000


CREATE NONCLUSTERED INDEX [NC] ON [dbo].[data]

(

[country] ASC

)WITH (STATISTICS_NORECOMPUTE  = OFF, SORT_IN_TEMPDB = OFF, IGNORE_DUP_KEY = OFF, DROP_EXISTING = OFF, ONLINE = OFF, ALLOW_ROW_LOCKS  = ON, ALLOW_PAGE_LOCKS  = ON) ON [PRIMARY]

GO


create proc sniffing @p1 char(10)

as

begin

select country,somecolumn from data where country=@p1

end

Go


–Let us execute stored procedure sniffing with the with parameter brazil.


exec sniffing ‘BRAZIL’

go


clip_image002


Optimizer picked up Index-seek in Non-clustered index and Row-ID lookup on table.


What happens when we execute the same procedure with parameter ‘USA’. Since the plan is already created and cached for ‘BRAZIL’ it is reused and plan which is generated for BRAZIL is Not an optimal plan for parameter USA.

exec sniffing ‘USA’ 

go


clip_image004


How to identify if the optimizer is using plan which compiled for sniffed parameter values  and not the current parameters value.


Let us enable statistics xml on


set statistics xml on


exec sniffing ‘USA’ 

go


Look at the XML plan for the ParameterCompiledValue and ParameterRuntimeValue.


Below is extract from XML plan and this output proves that the plan is compiled for parameter BRAZIL (ParameterCompiledValue) and it is used for parameter USA (ParameterRuntimeValue)

{

<ColumnReferenceColumn="@p1"ParameterCompiledValue="‘BRAZIL    ‘"ParameterRuntimeValue="‘USA       ‘" />

}


We will also see a huge difference in estimated and actual rows count if the parameter sniffing is impacting the plan

(Remember out dated stats can also cause optimizer to estimate incorrect rows so difference in estimate and actual rows doesn’t mean it is because of parameter sniffing ). 


What would have been the optimal plan if the parameter ‘USA’?


Let us execute the same procedure with recompile option


exec sniffing ‘USA’ with recompile

go


clip_image006


How to fix Parameter sniffing?


1. USE RECOMPILE: when you create the stored procedure. so the parameter is compiled every time it is called. This method can be used if the compile time is very less compared to execution time of bad plan

   Ex: create proc sniffing @p1 char(10) with recompile


2.  OPTION (RECOMPILE): for the statement which impacted by the parameter sniffing.  If the procedure has multiple statements recompile will impact only the particular statement.


3.  OPTIMIZE FOR HINT: Instructs the query optimizer to use a particular value for a local variable when the query is compiled and optimized (or)  OPTIMIZE FOR  UNKNOWN WHICH Instructs the query optimizer to use statistical data


instead of the initial values for all local variables when the query is compiled and optimized.  This value is used only during query optimization and actual values are used during execution.

{

alter proc sniffing @p1 char(10)  as
begin
select country,somecolumn from data where country=@p1
option (optimize for (@p1 = ‘USA’))

–option (optimize for (@p1 unknown))
end
}


4.   Assign the incoming parameter values to local variables and use the local variables in the query.  If you are in SQL Server2000 in which we don’t have OPTIMIZE FOR hint.

      Ken Henderson has blogged about it in http://blogs.msdn.com/b/khen1234/archive/2005/06/02/424228.aspx


5.   Trace Flag 4136 which is introduced in SQL Server 2008 R2 Cumulative Update 2, SQL Server 2008 SP1 Cumulative Update 7 and SQL Server 2005 SP3 Cumulative Update 9 introduce trace flag 4136 that can be used to disable  the "parameter sniffing" process  more details on http://support.microsoft.com/kb/980653


If you liked this post, do like us on Facebook at https://www.facebook.com/mssqlwiki and join our Facebook group https://www.facebook.com/mssqlwiki#!/groups/454762937884205/

Thank you,

Karthick P.K |My Facebook Page |My Site| Blog space| Twitter

Posted in Optimizer, Performance, SQL General, SQL Server Engine | Tagged: , , , , , , , , , , , , , , , , , | 6 Comments »

Optimizer Timeout or Optimizer memory abort

Posted by Karthick P.K on October 7, 2012

Optimizer Timeout

When the query processor finds itself consuming a lot of time optimizing a query, it may decide to stop the optimization process abruptly, and choose the best available plan. This is to ensure that the optimizer doesn’t end up optimizing forever. This is  called optimizer timeout (based on the number of plans considered relative to the cost of the best plan so far).

Optimizer memory abort

When queries become more complex number of potential plans to consider can quickly grow in thousands. Optimizer has limit for memory it is allowed to use , when the optimizer reaches the limit it ends with  optimizer memory abort.

When  timeout or memory abort happens optimizer might choose the best plan  from plans which was generated till timeout or abort and it might be far from optimal plan so the query execution can take long time and consume resource.

On SQL 2000 and earlier the only way to detect this condition is compiling the query with trace flag 8675.   If one of these conditions occur the output will reflect a timeout abort or memory abort, similar to the following:


End of simplification, time: 2.869 net: 2.869 total: 2.869 net: 2.869

end exploration, tasks: 200094 no total cost time: 16.17 net: 16.169 total: 19.04 net: 19.039

*** Optimizer time out abort at task 614400 ***

*** Optimizer time out abort at task 614400 ***


Msg 8623, Level 16, State 1, Line 3

The query processor ran out of internal resources and could not produce a query plan. This is a rare event and only expected for extremely complex queries or queries that reference a very large number of tables or partitions. Please simplify the query. If you believe you have received this message in error, contact Customer Support Services for more information.

End of simplification, time: 0.156491 elapsed: 0.156491

end exploration, tasks: 1614 no total cost time: 0.552436 elapsed: 0.708927

end search(0),  cost: 1275.32 tasks: 3888 time: 0.195008 elapsed: 0.903935

end exploration, tasks: 7596 Cost = 1275.32 time: 0.548032 elapsed: 1.45197

end search(1),  cost: 1263.15 tasks: 21985 time: 2.30564 elapsed: 3.75761

*** Optimizer memory usage abort ***

End of optimization,  elapsed: 2.98304

From SQL server 2005 to determine whether the query optimizer times out or MemoryLimitExceeded search for the 
StatementOptmEarlyAbortReason="TimeOut" (or) StatementOptmEarlyAbortReason="MemoryLimitExceeded" expression in the XML plan output.


We can avoid optimizer from timing out and picking bad plan by enabling trace flag –T8780. This increases the time limit before the timeout occurs.

Note: Don’t enable this trace flag at server level , enable it only for the session which runs the query and identify if the optimizer is picking up a better plan. If you see optimizer picking up the better plan, right approach is to tune the query manually or using DTA and apply the recommendations . You can use this trace flag till you apply the recommendations made by DTA.


If you experience “ Optimizer memory usage abort” use “SQLServer:Memory Manager\Optimizer Memory (KB)” counter to the amount used for compilation .

select * from sys.dm_os_memory_clerks where type=’MEMORYCLERK_SQLOPTIMIZER’ will tell us the overall memory used by optimizer.

We can also use the CompileMemory= expression in XML plan output starting from SQL server2005 SP2 which will give us the compile memory used by individual plans. If you find optimizer memory is very low then identify what is contributing to memory contention in SQL Server and tune it.

I will discuss compile memory in detail when I blog about Resource_semaphore  wait types.


Note: You may also receive below error because of few known issues documented in KB articles 982376, 946020,926773,917888 so if none of the fixes resolve the issue you may have to follow the same steps documented above.

{

"Msg 8623, Level 16, State 1, Line 1

The query processor ran out of internal resources and could not produce a query plan. This is a rare event and only expected for extremely complex queries or queries that reference a very large number of tables or partitions. Please simplify the query. If you believe you have received this message in error, contact Customer Support Services for more information."

}

If you liked this post, do like us on Facebook at https://www.facebook.com/mssqlwiki and join our Facebook group https://www.facebook.com/mssqlwiki#!/groups/454762937884205/


Thank you,

Karthick P.K |My Facebook Page |My Site| Blog space| Twitter

Disclaimer
The views expressed on this website/blog are mine alone and do not reflect the views of my company. All postings on this blog are provided “AS IS” with no warranties, and confers no rights.

Posted in Performance, SQL General, SQL Query, SQL Server Engine, SQL Server memory | Tagged: , , , , , , , , , , | 24 Comments »

Troubleshooting SQL Server high CPU usage

Posted by Karthick P.K on October 4, 2012

Troubleshooting SQL Server high CPU usage


First thing to determine when there is High CPU on systems is, if SQL server is consuming the CPU resource or other applications/service.


Use query in  THIS LINK to get CPU usage history (or) Task manager (or) Perfmon counter to determine that. In Perfmon, Process %Process time can also be used. Remember this counter is not based on 100%.  It is based on number of processor.  If you see 200 for sqlservr.exe and the system has 8 CPU, CPU consumed by sqlservr.exe is 200 out of 800 (only 25%).)


If the CPU spike is caused by other application involve application team.


Next step is to determine if the CPU consumed is kernel time or user time.


We can use Process %Privileged  time and %user Time counters in perfmon. Task manager will show kernel times which will also help us understand


Kernel CPU:  In general, if kernel CPU remains below 10%, it’s normal.  But if you see sustained kernel CPU at 30% or above, you should start looking at system drivers , Antivirus etc.  some known issues which can increase Kernel CPU time are

1.       Few Anti-virus software’s can cause high kernel time.  Temporarily disable anti-virus software to rule this out


2.       We have seen high resolution timer in SQL 2008 or SQL 2005 SP3 caused high kernel time in Virtual Machines because of outdated BIOS .  Temporarily disabling high resolution timer by turning on trace flag 8038 (configure as startup parameter) to prove this. Check for BIOS update and do not use 8038 in long term.


High user CPU: Some of the most common causes for High CPU in SQL Server  are

1.       Query execution causing CPU spike (Most commonly caused by optimizer picking bad plan).


2.       High compiles and recompiles. (schema, Stats change, Use of Temp table, Recompile hint).


3.       System threads spiking CPU (Ghost cleanup, Lazy writer, Resource monitor).


4.       Running many traces.


1. Query execution causing CPU spike:


Query execution  takes long times and spikes CPU commonly because of in-correct cardinality estimates caused by outdated statistics, Lack of Index, Server configuration, Distributed queries, etc.


When the server is experiencing this problem run the query in below link to list all the queries which are executing in the server order by CPU time desc along with plan.

{

Get SQL Text and Query Plan for statements which are executing now

}

 It could be one query which is driving the majority CPU time or Multiple queries each driving the CPU. Look at the CPU time of the above query output.


If it is single query/Store procedure which is driving the majority of CPU.


1.        Update the stats of tables and indexes used by the query (If the stats are up to date Estimated rows and estimated execution will  be approximately

same in execution plan .If there is huge difference stats are out dated and requires update) .


2.       Identify if the query has used bad plan because of parameter sniffing (If the ParameterCompiledValue and ParameterRuntimeValue is different in XML plan). Refer THIS LINK to know more about Parameter Sniffing


3.        If updating the stats and fixing the parameter sniffing doesn’t resolve the issue it is more likely optimizer is not able to create efficient plan because of lack of indexes and correct statistics. Run the query which is driving the CPU in database tuning advisor and apply the recommendations. (You will find missing index detail in xml plan but DTA is more efficient). You can follow the steps in Tune queries using SQL Server Database tuning advisor .


4.       If the query which is spiking the CPU is linked server query try changing the security of linked server to ensure linked server user has ddl_admin or dba/sysadmin on the remote server. More details regarding the issue in THIS LINK.


5.       Ensure optimizer is not aborting early and creating bad plan. For details refer THIS LINK.


6.       Ensure the query which is spiking the CPU doesn’t have plan guides (xml plan will have PlanGuideDB attribute.  Also sys.plan_guides will have entries) and query hints(index= or (option XXX join) or inner (Join Hint) join).


7. Ensure that SET options are not changed.


If it is Multiple queries/Store procedure are driving the CPU together.


1.       Update the stats of all the tables and indexes in the database. Using the query in below link Rebuild index and update statistics for all the tables in database


2.       If updating stats doesn’t help and rebuilding the indexes doesn’t bring down the CPU we have to tune the queries 1 by 1.


3.       Ensure Large amount of RAM is not causing optimizer to choose inefficient plan http://support.microsoft.com/kb/2413549


4.       Ensure that we do not run many traces at same time (commonly from monitoring tools). Use query in below link to list all the active traces.

{

Find all the profiler traces running on SQL Server

}


2. If the system thread is consuming most of the CPU.


1.       If none of the SQL queries are consuming majority of CPU,  we can identify if the back ground threads is consuming the majority of CPU by looking at  sysprocesses output for background threads. select * from sys.sysprocesses where spid<51.


2.       Check if you are hitting any of the known issues.

{

Resource Monitor may consume high CPU: http://support.microsoft.com/kb/968722

The Ghost Cleanup task uses 100% of the CPU on an idle system in SQL Server 2008 or in SQL Server 2005: http://support.microsoft.com/?id=978430

}


3. High compiles and recompiles: I will blog about high compiles and recompiles shortly


4. Other factors which can impact SQL Server query performance

1.       Maximum degree of parallelism. Ensure MAX DOP is set properly (you can follow the steps in How to set Max degree of parallelism (MAXDOP)


2.       Priority boost. (Do not enable priority boot)


3.       Do not enable Fiber mode.


4.       Tweaking affinity mask (Spikes few CPU).


5.       TokenAndPermUserStore. http://support.microsoft.com/kb/927396


6.       CPU power plan degrade the server performance http://support.microsoft.com/kb/2207548


7.       SQL Server that’s uses  .Net Framework can cause high CPU Refer THIS LINK


If you liked this post, do like us on Facebook at https://www.facebook.com/mssqlwiki and join our Facebook group

Related blogs: 

Tuning SQL Server query

Thank you,

Karthick P.K |My Facebook Page |My Site| Blog space| Twitter

Disclaimer

The views expressed on this website/blog are mine alone and do not reflect the views of my company. All postings on this blog are provided “AS IS” with no warranties, and confers no rights.

Posted in Configuration, Optimizer, Performance, SQL Server Engine | Tagged: , , , , , , , , , , , , , , , , , , , , | 28 Comments »